The Urban Institute released a comprehensive dataset on state-by-state spending on kids from 1997-2016. That data is here. The authors of it deserve all of the credit for creating it and for releasing it in such an easy-to-use, accessible way. They also licensed it with a creative commons-like license that allows use- and re-use, including modification, with attribution. Therefore, I want to say (as I say in the documentation for the package that I describe a bit below) that the data was made available by and is attributable to Julia Isaacs, Eleanor Lauderback, and Erica Greenberg under the under the ODCAttributionLicense.
It’s an awesome resource, and I started to play around with it. It is released through that website as an Excel file (though it is also available through the ICPSR as a Stata file). My inclination was to try to load all of the data. Though there were 69 worksheets in the Excel file, each worksheet had similar characteristics; primarily a row for each state for each year. Also, the Excel file was structured with the worksheets in groups of three; the first worksheet was the amount spent, whereas the second and third within each group used inflation-adjusted dollars, with the third also being calculated on a per-child basis. After a few attempts, I decided to structure the data to have three different columns for the three different ways of calculating the amount spent. This effectively reduced the number of variables from 69 to 23. It also made it a bit easier to combine the data to be in a single file; there is a column for the state, and for the year, and for the variable, and then variables for each of the three ways of calculating the amount spent.
I put this file in an R data package and over-cleverly named it tidykids, since the data was in a (quasi-) tidy format, quasi because each of the three ways of calculating the same variable could be combined into a single variable, with a second variable indicating how each was calculated. But, that seemed less useful in this case, whereas having all of the variables represented in a single column seemed more important (in part because it’s easier to use this data with packages that are a part of the tidyverse, especially {ggplot2}).
I also found it not too much of a step further (because of how well-structured the data was initially, and with it in a single file) to share an interactive (Shiny) web application, available here: https://jmichaelrosenberg.shinyapps.io/tidykidsshiny/
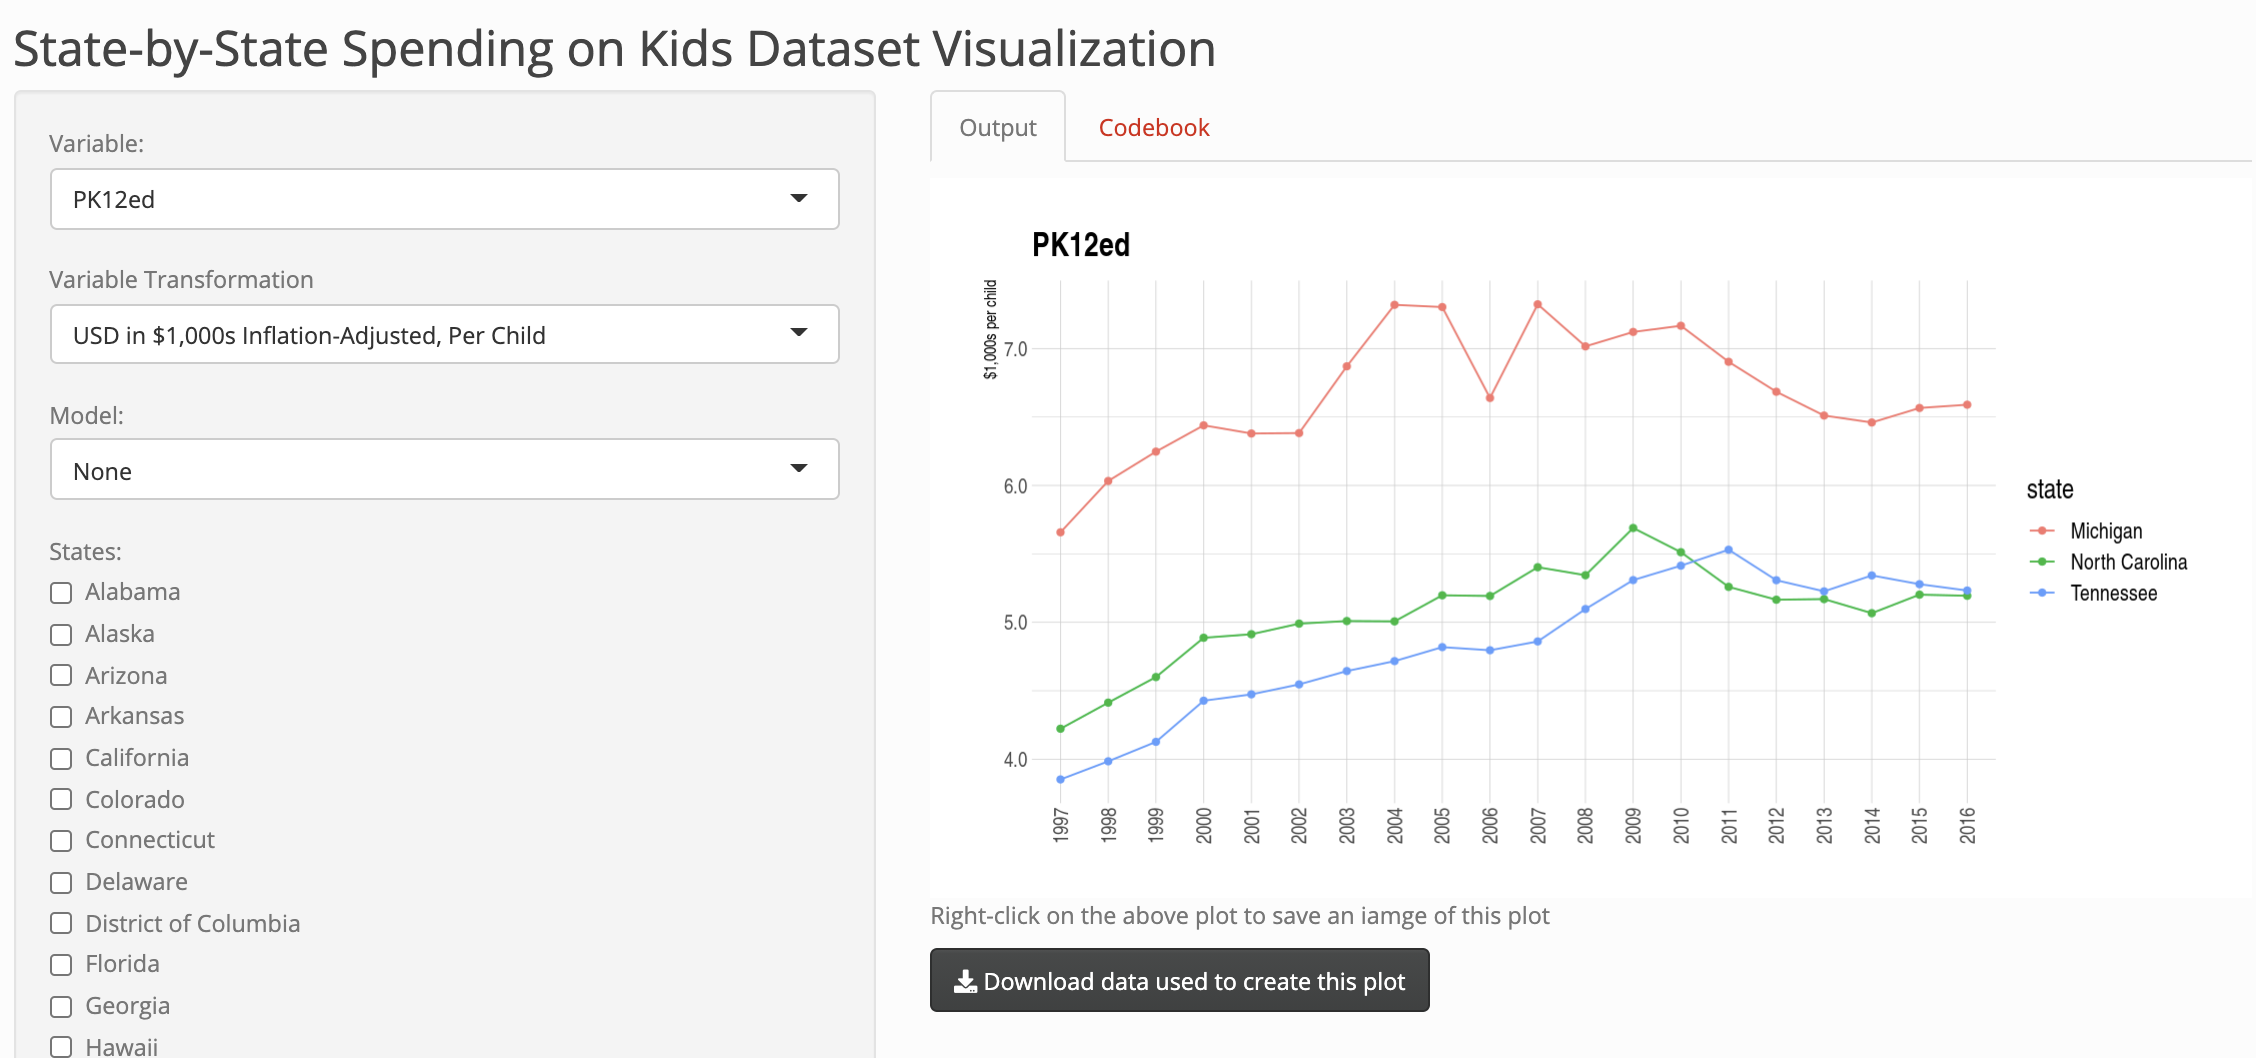
That interactive web application includes the codebook/data dictionary in a way that I think makes it even easier to browse through the varaibles in the dataset. It also allows you to download a CSV file with the data used to create whatever plot is created.
So, this was a fun project - something to keep me on my toes as an R developer, and a chance to learn a bit about a dataset I hope to use in research (or teaching) going forward.