We started using Mint to keep track of our spending. One of the best features of Mint is the ability to see past patterns of spending (and to use that information to not spend quite as much on, well, coffee, and for those who know me well, sandwiches from Woody’s Oasis).
I listened to an episode of the Not So Standard Deviations, in which the hosts Peng and Parker discussed using spreadsheets and R to keep track of information for taxes.
This sparked my interest, and I checked Mint to see whether they offered the option to export information from it in any way, shape, or form. They do!
In short, “At the end of the page containing a list of transactions there is a link ‘Export all xxxx transactions’.”
Easy enough. I did it.
I then loaded up R and prepared the data (the name of the file should be the same, although if it is in a folder other than Downloads, you’ll have to change that – otherwise, this should work for you):
library(tidyverse) # if not yet installed, use "install.packages("tidyverse")" the first time you use the package
library(stringr) # same for "install.packages("stringr")"; only necessary first time
library(lubridate) # same for "install.packages("lubridate")

df <- read_csv("~/downloads/transactions.csv")
df$Date <- mdy(df$Date)
df$date_r <- round_date(df$Date, "week")
df$wday <- wday(df$Date, label = T)
I thought Meijer – our grocery store – would be interesting to look at as a first step:
term <- "Meijer"
df_ss <- filter(df, str_detect(Description, term))

ggplot(df_ss, aes(x = date_r, y = Amount)) +
      geom_col() +
      geom_smooth(color = "red", se = F) +
      ggtitle(paste("Amount of Money Spent at", term)) +
      ylab("Amount ($) Per Week") +
      xlab(NULL) +
      scale_x_date(date_breaks = "3 months")
Here’s the results (with a smooth curve fit to the data):
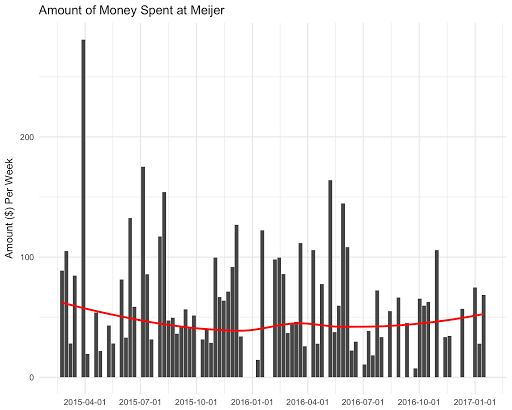
One thing that surprised us is how consistently we spend around $50 / week, because in summer. Perhaps we’re purchasing other (non-grocery) items in the winter? Not sure - and perhaps not something available through Mint’s data. Nevertheless, the takeaway from this (or at least one) is that the data Mint and other companies is not, or at least does not have to be, something “out there,” but rather is ours, so we can, sometimes, get our hands on it and maybe learn something potentially worth knowing.
My cousin Jacob pushed me to consider why I used R (instead of just using Mint or doing it in some other way, such as through Google Sheets). It was a good comment, and eventually I ended up here: data are not often cleaned, aggregated, or ready to go in terms of creating a plot or using a model, and R is good for cleaning and aggregating (and plotting and modeling) data.